Visualizing webserver's access log data to help detecting malicious activity
Writers: Hakkari Onni, Project Engineer & Ahonen Joni, Project Worker, JAMK University of Applied Sciences, Institute of Information Technology
Introduction
The CinCan project aims to design and construct automated toolchains for the use of security analysts. These project-designed automated toolchains can be used to tackle the analysts manual tooling chains which they have been found occurring frequently.
Simply put, the toolchain can be considered as a series of entirely or partly isolated tools that are glued together in a way that one's output is used as the next tools input.
The Docker containers are used for the tool isolation. In this blog post we introduce how one of the project-made isolated tool was constructed and how it can be used to visualize single webserver's access.log data using Jupyter notebooks.
Deploying Docker container
Following commands can be used for deploying data visualization container with an assumption that you have installed Docker and GIT on your system. Remember also to change the example access.log file with your own log file to get correct results.
When the commands are executed you should find the output.html file from the samples directory.
git clone https://gitlab.com/CinCan/dockerfiles.git
cd dockerfiles/access_log_visualization
docker pull cincan/access_log_visualization
docker run -v "$PWD":/samples cincan/access_log_visualization
Example cases to detect malicious activity
Our objective is to detect malicious activity from WordPress webserver access log. All cases (1-3) have individual highlighted visualization for the remote host we are investigating at the time. Used visualizations are produced by above Docker container containing Jupyter notebook that prepares and visualizes access.log data.
Case 1: remote_host 4
Remote host 4 seems to use one browser and one OS. Only request method used is OPTIONS and remote host is ::1, which is localhost. Nothing seems suspicious.
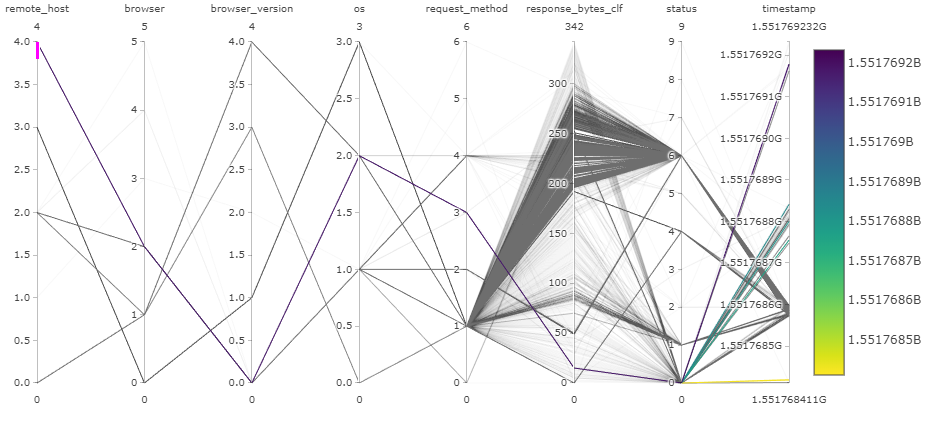
We can verify used request method by querying by numerical value and showing only categorical value:
df.query("request_method_cat == 3")["request_method"].head(1)
0    OPTIONS
Name: request_method, dtype: object
Verify IP address:
df.query("remote_host_cat == 4")["remote_host"].head(1)
0    ::1
Name: remote_host, dtype: object
Case 2: remote_host 3
Remote host 3 uses one browser and one OS. However, there are several response sizes, which indicates that different pages are requested from the webserver. Two request methods are used: GET and POST. This indicates that the user have been browsing the website and posting comments or logging in. Nothing seems too suspicious, it could be the site administrator or actively commenting user.
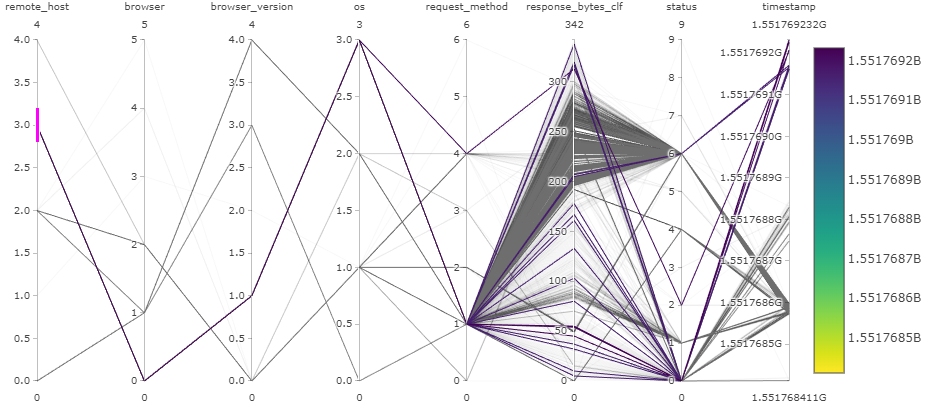
Verify request methods:
df.query("request_method_cat == 1")["request_method"].head(1)
0    GET
Name: request_method, dtype: object
df.query("request_method_cat == 4")["request_method"].head(1)
0    POST
Name: request_method, dtype: object
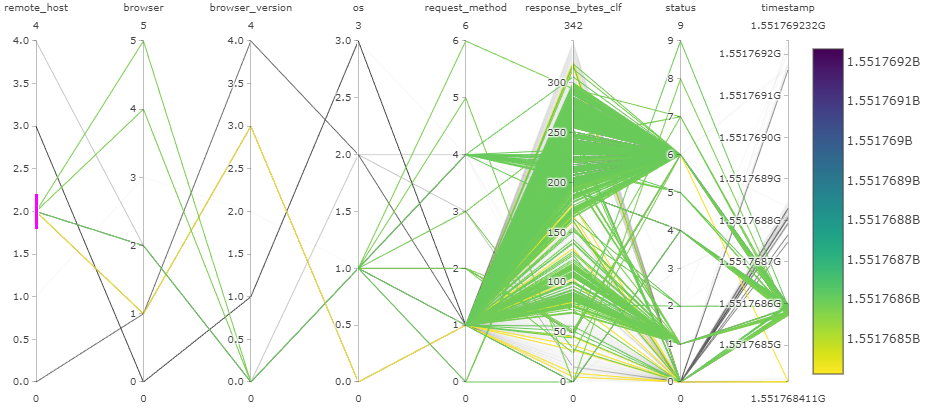
Case 3: remote_host 2
Remote host 2 seems to use 4 different browsers and 2 different operating systems. All 7 request methods are used and various sizes of responses are sent. There have been 10 different http status codes. All of this happened in very narrow time frame. All of this indicates that website is being scanned by remote host 2 (192.168.56.113), and further examination reveals some suspicious request url paths, which does not belong to ordinary WordPress website, such as:
- /19216856108.tar.lzma
- /192.168.56.108.cer
- /TcERJyh7.js
- /web/BetaBlockModules/MessageModule/MessageModule.php
- /admin1.php
- /components/com_mosmedia/media.divs.php
- /perl/
- /manual/images
There are total of 7549 requests from remote host 2!
User agent in the request headers are often reported to be very similar with Mozilla/5.00 (Nikto/2.1.6) (Evasions:None) (Test:002246), but there are many slightly different user agents. This indicates that the remote host 2 is indeed scanning (Nikto) the WordPress website.
Verify IP address:
df.query("remote_host_cat == 2")["remote_host"].head(1)
0    192.168.56.113
Name: remote_host, dtype: object
Verify request methods:
list(set(df.query("remote_host_cat == 2")["status"]))
['405', '302', '404', '301', '500', '400', '417', '403', '200']
Verify request url paths:
list(set(df.query("remote_host_cat == 2")["request_url_path"]))[:10]
[nan,
 '',
 '/OA_HTML/jsp/wf/WFReassign.jsp',
 '/system/console/bundles',
 '/Administration/Includes/contentHome.php',
 '/information/',
 '/chat/adminips.php',
 '/adodb/adodb-errorpear.inc.php',
 '/elseif/utilisateurs/commentaire.php',
 '/level/58/exec//show']
Verify amount of requests:
len(list(df.query("remote_host_cat == 2").index))
7549
Verify user agents:
list(set(df.query("remote_host_cat == 2")["request_header_user_agent"]))[:10]
['Mozilla/5.00 (Nikto/2.1.6) (Evasions:None) (Test:004411)',
 'Mozilla/5.00 (Nikto/2.1.6) (Evasions:None) (Test:000139)',
 'Mozilla/5.00 (Nikto/2.1.6) (Evasions:None) (Test:000001)',
 'Mozilla/5.00 (Nikto/2.1.6) (Evasions:None) (Test:003809)',
 'Mozilla/5.00 (Nikto/2.1.6) (Evasions:None) (Test:000405)',
 'Mozilla/5.00 (Nikto/2.1.6) (Evasions:None) (Test:002110)',
 'Mozilla/5.00 (Nikto/2.1.6) (Evasions:None) (Test:004502)',
 'Mozilla/5.00 (Nikto/2.1.6) (Evasions:None) (Test:004577)',
 'Mozilla/5.00 (Nikto/2.1.6) (Evasions:None) (Test:003995)',
 'Mozilla/5.00 (Nikto/2.1.6) (Evasions:None) (Test:001408)']
Conclusions
If the right visualization method is chosen for particular task, one can gain plenty of information from a single plot. Parallel coordinates visualization can seem very overwhelming at first, but when examined slightly longer, it can give a good overview of the data we are trying to understand.