Day 22 - Access.log visualization using Jupyter Notebook
Writer: Vesa Vertainen, Project Engineer, JAMK University of Applied Sciences
This Christmas we are blogging one tool each day, thanking it's makers and maintainers
Jupyter Notebook is an application to edit and run notebook documents in a browser. The notebook documents can contain "live code, equations, visualizations and narrative text". Over 40 languages are supported. Today's tool, cincan/access-log-visualization, uses Jupyter Notebook to visualize a webserver's access log data to help detecting malicious activity, currently supporting default Apache access.log only. It was compiled in the CinCan project by Onni Hakkari and Joni Ahonen from JAMK University of Applied Sciences. The language used in the notebook is Python.
The tool needs an access.log file as input, and returns a HTML file as output. It can be run using Docker or the CinCan command line tool. For example, to visualize the access.log file provided in the CinCan tools repository, we can run the CinCan command line tool like this:
~/tools$cincan run cincan/access-log-visualization -i _samples/log/access.log
If output directory is not specified, the output.html can be found in the same directory as the input. We can do the same with Docker, this time specifying the output folder:
~/tools$docker run --rm -v $(data):/data cincan/access-log-visualization -i /data/_samples/log/access.log -o /data
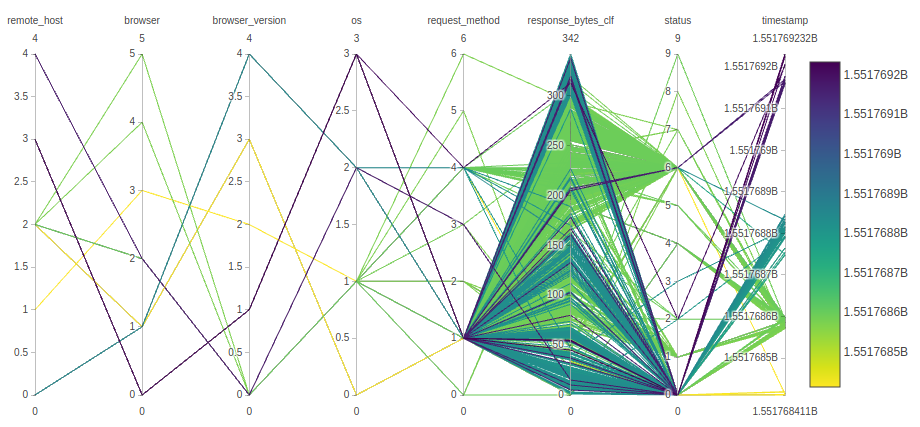
Visualization from the output.html
Read more
This, and many other tools can be downloaded from the CinCan’s Gitlab repository, and the Docker hub.